Westmoreland Coal - A Review Part 2

By Alexis Tate
September 3, 2017 - A positive aspect of Westmoreland Coal (WLB) is its customer base—it supplies coal to utilities with strong balance sheets. A lot of its customers on long-term contracts are highly rated.
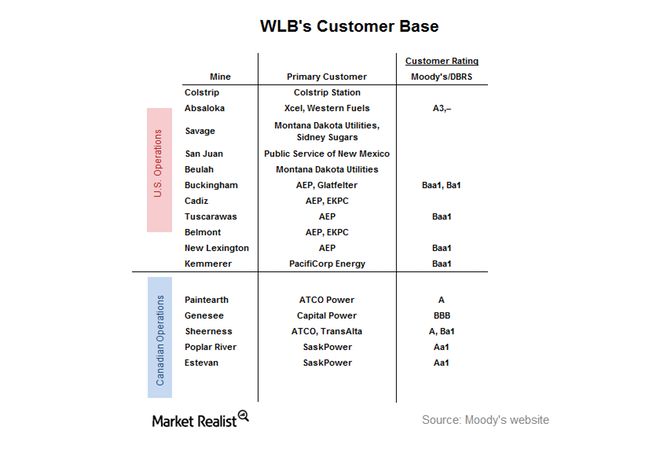
In 2016, 83% of WLB’s Coal-US segment revenue was derived from coal sales to five customers: PPNM (28%), Colstrip Units 3 and 4 (22%), Colstrip Units 1 and 2 (12%), American Electric Power (AEP) (11%), and NRG Texas Power (10%).
Meanwhile, Westmoreland Resource Partners (or WMLP) derived ~77% of its revenue from coal sales to three customers: American Electric Power (AEP) (38%), PacifiCorp Energy (29%), and East Kentucky Power Cooperative (10%). In the same year, 86% of revenue from the Coal-Canada segment was from coal sales to three customers: SaskPower (42%), the country of Japan (29%), and ATCO Power (15%).
Seaborne Business
Westmoreland Coal’s (WLB) Coal Valley mine produces coal containing 10,800 British thermal units per pound for the export market. Most the coal produced from the Coal Valley mine is exported to Asian utilities and commodity traders. The exports are done through the Westshore Terminals and Ridley Terminals in British Columbia, Canada. In April 2017, a ban or tax on thermal coal from British Columbia’s ports was proposed, which may pose a challenge for WLB’s seaborne market.
Cost Structure
Most of Westmoreland’s customers are located in the Northern Midwest and on the West Coast. In these regions, coal is much more competitive than natural gas as a fuel for power generation. Therefore, it is safe to say WLB faces less of a threat from natural gas than coal producers (KOL) Alpha Natural Resources (ANRZQ) and Arch Coal (ARCH), which are located in the East—where natural gas is more competitive.
An Overview of Westmoreland Coal’s Financial Position
Debt Structure
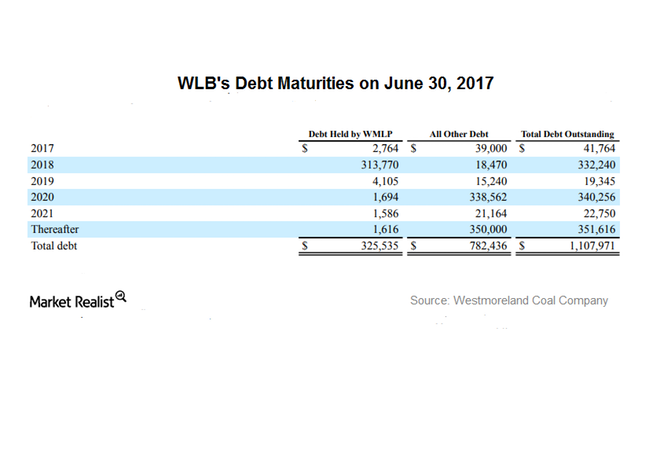
Westmoreland Coal (WLB) had debt of ~$1.1 billion on June 30, 2017. This total includes $350.0 million in senior notes due to mature on January 1, 2022, with interest of ~8.8% payable semiannually.
Of the ~$1.1 billion debt, $323.0 million comprises a term loan with an interest rate of 7.6%, $309.0 million comprises a WMLP (Westmoreland Resource Partners) term loan with an interest rate of 9.8%, and $76.0 million comprises a San Juan loan with a cash interest rate of 10.4%.
An Overview of Westmoreland Coal's Financial Position
Of WLB’s debt, $338 million is maturing in 2020. Westmoreland Coal also has an asset retirement obligation of ~$490.0 million. WLB’s total debt-to-last-12-month EBITDA 1 ratio was 6.9x, compared with Arch Coal’s (ARCH) 0.97x, Peabody Energy’s (BTU) 2.0x, and Cloud Peak Energy’s (CLD) 3.6x.
Liquidity
Unlike other coal producers (KOL), WLB doesn’t have much liquidity. As of June 30, 2017, its liquidity comprised $57.6 million in cash and cash equivalents and $42 million in available lines of credit. The low liquidity is partially offset by cash-generating operations. The company generated $151 million through operations in 2016, much higher than the $45 million generated in 2015. However, cash generated from operations in 1H17 was $10 million, much lower than the $41 million generated in 1H16. The decrease was due to net losses incurred by the company in 1Q17 and 2Q17. In the next part of this series, we’ll discuss Westmoreland’s profitability and cash flow.
How Westmoreland Coal Maintains Positive Cash Flow Each Quarter
Range-Bound Margins
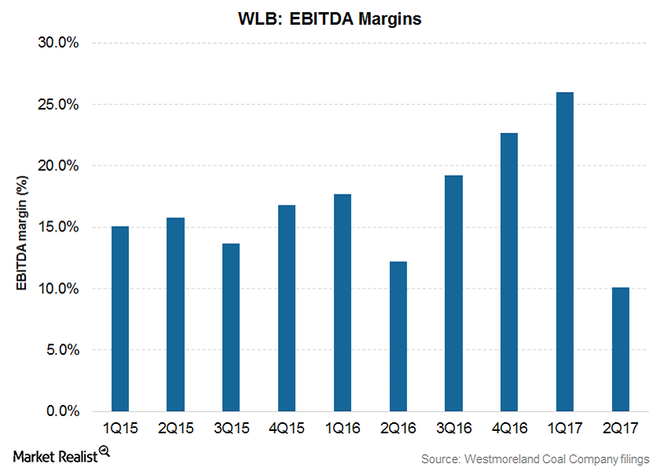
Since the majority of Westmoreland Coal’s (WLB) contracts are long-term cost-protected contracts, its margins are protected. Many contracts have high-margin reclamation. The company’s EBITDA1 margins have remained between 10% and 26% during the last six quarters.
How Westmoreland Coal Maintains Positive Cash Flow Each Quarter
This trend contrasts with that followed by other major coal producers (KOL) such as Peabody Energy (BTU), Cloud Peak Energy (CLD), and Arch Coal (ARCH), where pricing is driven by some benchmarks and profitability fluctuates with changes in benchmark prices. However, you should note that Westmoreland Coal has seen net losses for the past three years.
Cash Generating Operations
WLB has generated positive free cash flow in each of the past ten quarters. According to the company’s latest filing, its free cash flow yield is more than 85%. As discussed earlier, most of its contracts with customers are long-term cost protection contracts. Westmoreland receives a certain percentage over and above the cost of production. Therefore, irrespective of the market price of coal, Westmoreland Coal generates positive cash flow from its operations. The inclusion of a cost recovery clause in contracts is an added advantage for the company.
Outcome
Whereas Westmoreland’s cost recovery clause protects against downside, the company may not see as much profit as peers if market prices for coal rise sharply. Also, since the majority of WLB’s contracts are long term, with an average life of up to 2022, the company must wait for a continuous uptrend in coal prices.
What Could Affect Westmoreland Coal Stock
Review of 2017
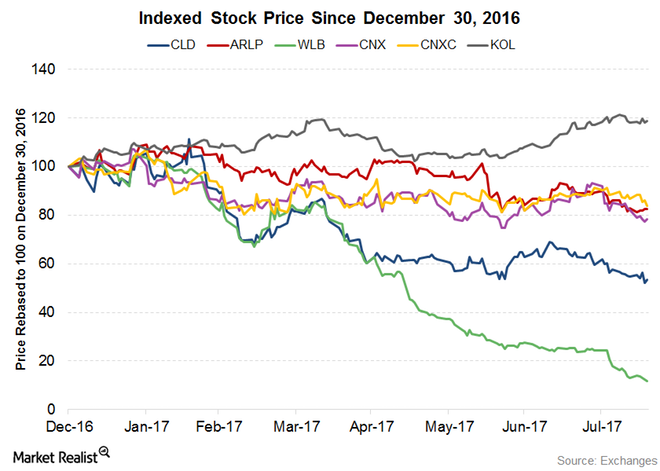
In 1H17, the broader market, tracked by VanEck Vectors Coal ETF (KOL), has outperformed coal stocks, which have followed a downward trend so far this year.
What Could Affect Westmoreland Coal Stock
As of August 25, 2017, Westmoreland Coal (WLB) had fallen the most year-to-date, witnessing a loss of 87% so far in 2017. Peers Cloud Peak Energy (CLD), CONSOL Energy (CNX), and Alliance Resource Partners (ARLP) have fallen 43%, 23%, and 18%, respectively. CNX Coal Resources has fallen 15%, and the VanEck Vectors Coal ETF has gained nearly 24%.
Environment Regulations
President Donald Trump signed an executive order on March 28, 2017, to repeal all rules and guidelines brought in place by the Obama administration to combat climate change. The new regulation includes reversal of the moratorium put in place by the Department of the Interior on private companies leasing federal land to coal miners in January 2016. In June 2017, the United States was withdrawn from the Paris agreement on climate change. These reforms are expected to positively affect the coal industry.
Coal’s Share in Electricity Generation
According to the EIA’s (U.S. Energy Information Administration) latest short-term energy outlook, coal’s and natural gas’s share of electricity generation is expected to be almost even this winter.
The EIA expects natural gas’s share of electricity generation to be ~31% in 2017, a fall from 34% in 2016. The decline is attributed to higher natural gas prices, increased generation from renewables and coal, and lower electricity demand. Coal’s share is forecast to be ~32% in 2017, up from 30% last year. In the next and final part, we’ll compare WLB’s and peers’ valuation.
Why Westmoreland Coal Stock has a High Return Potential
Westmoreland Coal’s Valuation
A company’s valuation is helpful for comparing the company with peers. The cost of a company’s stock is represented by the EV-to-EBITDA1 multiple. A high EV-to-EBITDA multiple implies that the company in question is overvalued compared with peers.
Why Westmoreland Coal Stock has a High Return Potential
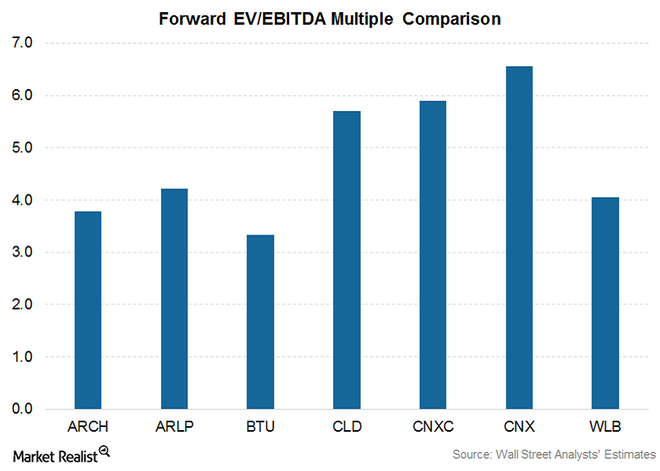
The coal (KOL) industry is a capital-intensive business. Therefore, companies in this industry raise capital through a variety of sources to fund expansion plans. As a result, their capital structure can vary significantly. However, a company’s EV-to-EBITDA multiple isn’t affected by its capital structure, which makes it a useful way to compare companies’ valuation. The forward EV-to-EBITDA multiple concerns the company’s EBITDA for the next 12 months.
On August 25, 2017, Westmoreland Coal’s forward EV-to-EBITDA multiple value was 4.1x. Peabody Energy (BTU) had the lowest forward multiple in the peer group, with 3.3x, followed by Arch Coal’s (ARCH) 3.8x. CONSOL Energy (CNX) had the highest forward EV-to-EBITDA value, of 6.6x.
Analysts’ Price Targets
Why Westmoreland Coal Stock Has a High Return Potential
On August 25, 2017, analysts had a consensus 12-month target price of $6.38 for Westmoreland Coal (WLB). Price targets of peers Arch Coal (ARCH), Peabody Energy (BTU), Alliance Resource Partners (ARLP), and Cloud Peak Energy (CLD) were $97.60, $35.70, $25.70, and $4.30, respectively.
Return Potential
Considering its closing price of $2.24 on August 25, 2017, Westmoreland Coal has the highest return potential, of 184.6%, among peers.

