Commodity Tracker: 7 Charts to Watch This Week

March 16, 2020 - The coronavirus pandemic continues to play havoc with commodity markets, but while many products have been pummeled by the weak demand outlook and the eruption of an oil price war, others are proving more resilient. S&P Global Platts news and pricing editors sort the bullish from the bearish in raw materials and energy markets.
1. VLCC rates spike on Saudi crude deluge, floating storage demand
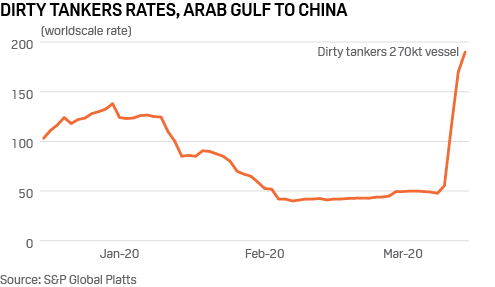
What’s happening? Asian VLCCs were hit hard by the coronavirus outbreak, with the benchmark Persian Gulf-China rate down by over 50% since the start of this year. This was due to a drop in crude purchases from China. But almost overnight, oil prices headed south towards the $30/b mark and Saudi Arabia decided to flood the market with crude. Saudi Arabia’s shipping company Bahri chartered more than a dozen VLCCs from the spot market and around three dozen VLCCs were chartered in the Persian Gulf in 24 hours, sending VLCC rates through the roof.
What’s next? As Saudi Arabia and Russia fight for market share, Riyadh has threatened to ramp up crude production to 12.3 million b/d by April. This will boost tanker demand, which is also seeing strong support from the floating storage market as traders take advantage of the wide contango in oil prices. Amid these factors, tanker rates will remain supported.
2. US forward gas prices lift despite plunging oil…
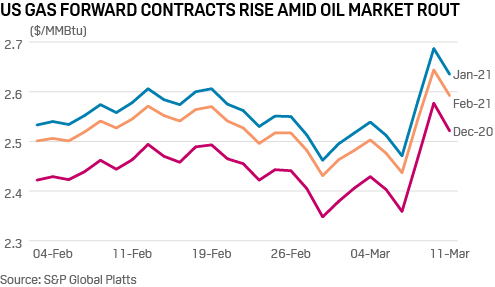
What’s happening? US benchmark natural gas prices for next winter’s peak-demand months of December, January and February have strengthened as much as 20 cents, or about 9%, over the past week as forwards markets respond to the recent fallout in oil prices. On March 10, the January 2021 contract edged up to $2.69/MMBtu, or its highest since mid-January. The move suggests that traders anticipate a slowdown in oil and liquids drilling this year, which could be sufficient to lower US production of associated gas and trim next winter’s inventory levels.
What’s next? According to S&P Global Platts Analytics, US associated gas production is likely to remain flat this year, even amid a slowdown in oil and liquids drilling. Stickiness in associated gas production is attributable to various factors, but stems primarily from the production profile of the typical unconventional well, which tends to yield a higher gas-to-oil output ratio over time. In a worst-case scenario, Platts Analytics expects that sustained oil prices around $30/b could see total US gas production decline modestly through December, falling some 400 MMcf/d to 800 MMcf/d from its current level around 91.2 Bcf/d.
3. …and LNG spot and long-term prices diverge
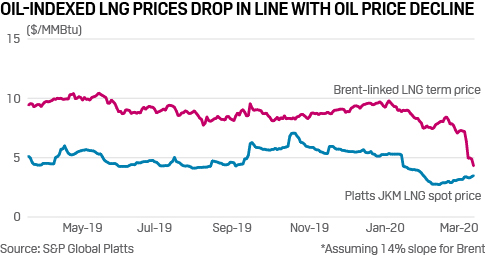
What’s happening? Over 70% of LNG is sold on fixed long-term contracts where cargoes are priced on the basis of oil. These oil-indexed LNG contracts have been expensive for Asian buyers due to high oil prices, compared to spot LNG prices according to the Platts JKM price assessment. But this week, the oil price crash closed the gap between oil-indexed and spot LNG prices, with major implications for current and future LNG markets.
What’s next? The convergence of spot and long-term LNG prices will depend on how long oil prices stay low and the lag between the oil price decline and LNG cargo pricing. A prolonged period of low oil means Asian buyers will benefit and gas exporters like Qatar, Australia and Malaysia will feel the pain. It will also trickle into contract negotiations, new supply deals and even has the potential to make gas more competitive in the long run.
4. China steel inventories mount as industries languish…
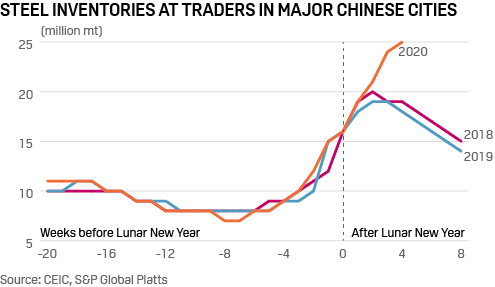
What’s Happening? Finished steel inventories held by traders always rise around the Lunar New Year as economic activity slows over the week long national holiday. Inventories typically peak and start to draw down around two weeks after new year as workers return to the cities and China’s factories and building sites return to life. This year the coronavirus outbreak has disrupted this cycle. Four weeks after the start of the new year inventories are still rising as end user demand remains weak. Only around 45% of China’s small and medium-sized enterprises (SMEs) had resumed work by early March according to the Ministry of Industry and Information Technology (MIIT).
What’s Next? Inventories should peak and start to draw down over the next few weeks as mills cut production to balance supply and demand. A sharper than expected drawdown will be evidence of a stronger than expected rebound in demand.
5. …but iron ore, met coal resist downward pressure so far
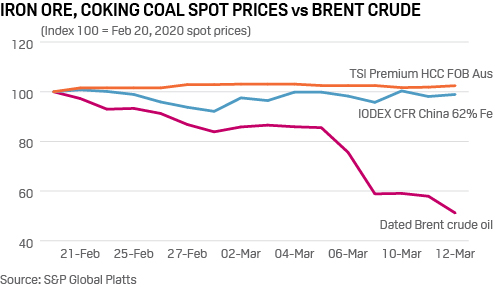
What’s happening? Iron ore and coking coal prices have seen little change in the past two weeks despite a sharp slide in oil and global equity markets. Global iron ore demand is led by China, which relies mainly on imports of the product for its steelmaking. China is trying to keep steel production up as the economy recovers from the coronavirus outbreak, with forward steel demand supported by new stimulus measures. Iron ore supply in southern Brazil fell on heavier than usual rain this year, and cyclone activity disrupted loadings in Western Australia earlier. Coking coal prices are diverging falling thermal coal, with coking coal supply in Queensland affected by port suspensions recently on seasonal rain.
What’s next? China’s steel production increase in 2019 to almost 1 billion mt, and planned growth for 2020, are increasing demand for iron ore and coking coal imports. Chinese raw materials demand may see temporary swings should weak steel margins persist, and as high steel inventories draw down. Seaborne and Chinese raw material supply typically improves in the second half of the year, and any weakness to global steel demand from the coronavirus outbreak may mean suppliers rely more on Asian spot markets, and boost availability. Higher China domestic coking coal and coke prices than imports continue to support trade, as India expands steel production further and is reliant on imported met coal and coke.
6. Europe’s bloated gas stocks paint bearish picture for summer
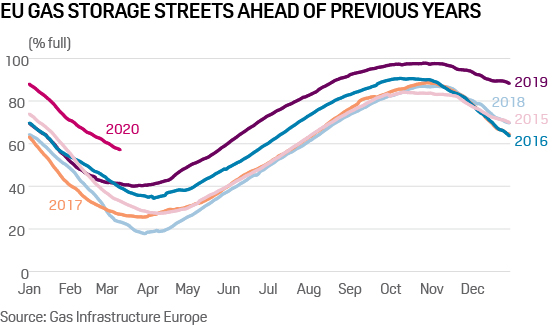
What’s happening? With just over two weeks left of the traditional European gas storage withdrawal season, the level of fullness in EU stocks is well above anything seen in recent years. Storages across the EU are currently around 57% full, compared with 41% full this time last year and just 23% full in mid-March 2018 when stocks had been drawn down to record lows by the Beast from the East cold spell.
What’s next? The high level of stocks – built up to almost capacity last year on fears of disruption to Russian gas flows via Ukraine – points to the likelihood of limited injection demand through the summer season. With the global glut of LNG persisting, Europe will not find it so easy to absorb the surplus LNG through storage this summer, which could bring more price pressure amid already bearish European gas market conditions.
7. EU carbon prices show resilience amid market slump
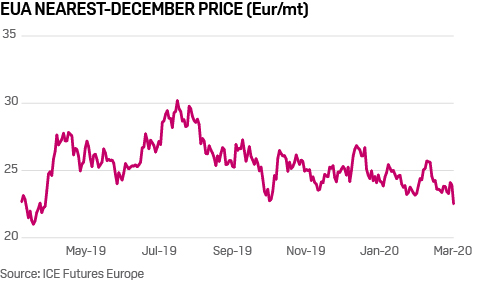
What’s happening? EU carbon dioxide allowance prices have been pressured along with the wider slump in global equities last week, as carbon was caught up in a wider risk-off attitude among investors. However, compared with the meltdown in global stock markets, carbon prices have shown relative resilience, holding above Eur21.00/mt since April 2019. This was firstly because the price is buffered by the Market Stability Reserve, which automatically takes out surplus allowances by reducing government auction volumes the following year. Secondly, the EU is looking to bolster its carbon market, potentially widening it to new sectors, to help reach net-zero emissions by 2050.
What’s next? Coronavirus remains a major wildcard for carbon prices. Signs of a peak and early decline in the global spread of the virus would likely give a boost to equities and oil prices. Conversely, continuing outbreaks risk triggering further losses due to the risk of a more prolonged economic disruption, and related demand losses across the commodity spectrum including carbon. The markets will also be watching the UK. Following Brexit, Britain is set to legislate its own domestic carbon market and carbon tax policy March 19, ahead of leaving the EU ETS on December 31, 2020.